Insight elements are modular blocks you can add to any report in Caplena to highlight key findings, add context, or visualize data. They help turn your analysis into a narrative that’s easy to understand and share with stakeholders.
Caplena offers different types of Insight Elements, grouped by purpose:
-
Scores & Ratings – For metrics like NPS or star ratings
-
Drivers & Trends – To show what impacts scores and how topics evolve
-
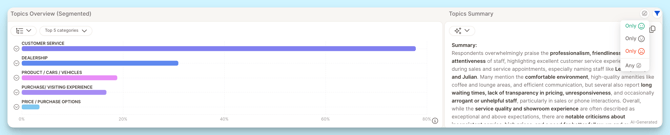
Topic Visualizations – To compare frequency or sentiment across topics
-
Text-Based Elements – For summaries, notes, or verbatim quotes
-
Distributions & Overviews – To display numerical or categorical patterns
💡 Tip: Combine elements from different groups to create a well-rounded, insight-driven report.
How to Add an Insight Element
- Go to the report (make sure you are in Edit mode).
- Click "+ Add new insight element here".
- Choose your desired element.

Once you’ve added your Insight Elements, you can tailor both how they look and what they include.
View Options (Insight Elements Display)
View options control how the data is displayed. View options do not change the base of respondents.
Examples of view types:
-
Bar chart vs. treemap
-
Segmented bar vs. breakdown layout
- Show “Top 10 Topics” or a specific category
Example:
Switching from “Topics Overview (Segmented)” to “Topics Overview (Treemap)” presents the same data in a different layout, no change to the respondent base.
Individual Filters
Each Insight Element lets you refine the data it shows, without affecting other elements in the report. These filters do change the base of respondents shown in that specific element.
You can:
-
Include or exclude specific topics or categories
-
Skip empty rows
Example:
Show only comments mentioning “flight delays” in a Topics Overview chart.
Explore Responses Behind the Data
You can click on any Insight Element to drill down and see the actual responses that power it.
If Sentiment Analysis is enabled, you’ll also be able to filter by sentiment to explore positive, neutral, or negative feedback in context.